Investor
Financial Highlights
(Million yen)
| 2021/5 | 2022/5 | 2023/5 | 2024/5 | 2025/5 | |
|---|---|---|---|---|---|
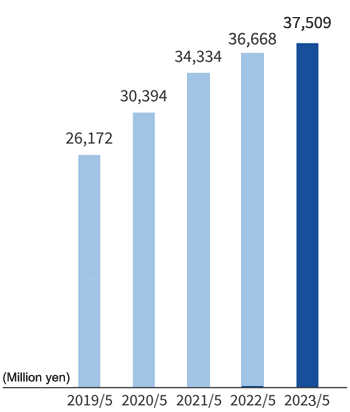
| Net sales | 34,334 | 36,668 | 37,509 | 37,207 | 42,705 |
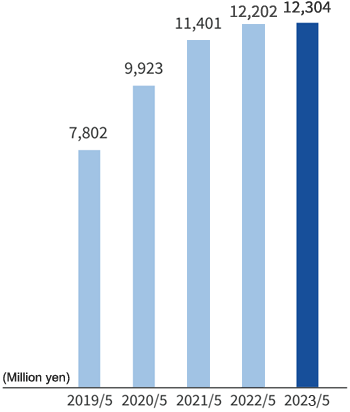
| Gross profit | 11,401 | 12,202 | 12,531 | 12,474 | 14,252 |
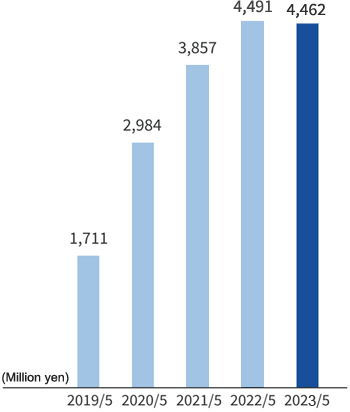
| Operating profit | 3,857 | 4,491 | 4,451 | 4,348 | 4,481 |
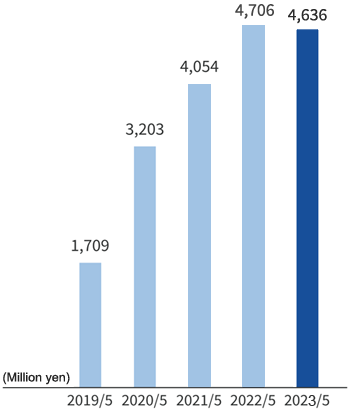
| Ordinary profit | 4,054 | 4,706 | 4,624 | 4,597 | 4,633 |
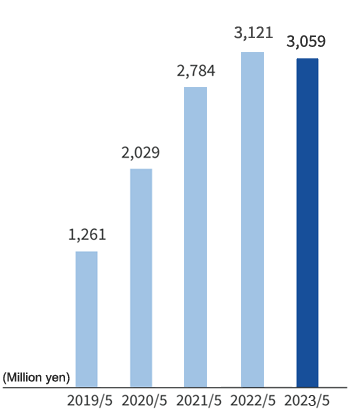
| Profit attributable to owners of parent | 2,784 | 3,121 | 3,051 | 3,032 | 3,203 |
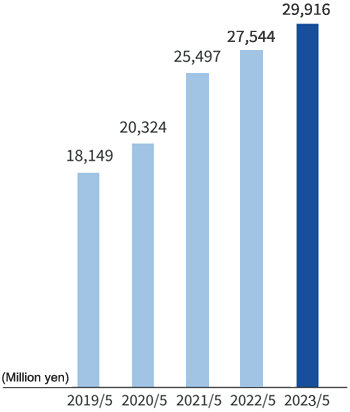
| Net assets | 25,497 | 27,544 | 29,869 | 32,592 | 34,053 |
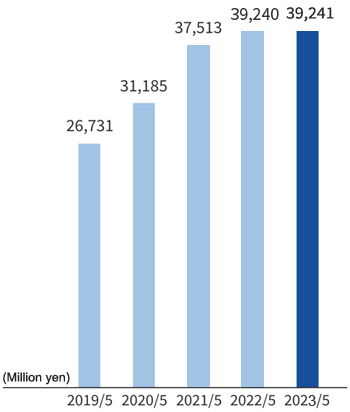
| Total assets | 37,513 | 39,240 | 39,194 | 41,423 | 52,011 |
Net sales
Gross profit
Operating profit
Ordinary profit
Profit attributable to owners of parent
Net assets
Total assets